Table of Contents
Weather Shifts
Climate and weather events now take place in a world that is different from the one our grandparents knew. The average temperature of the atmosphere is warmer. Oceans are also heating up, and polar ice is melting, as are many glaciers. Heavy bouts of rain and snow are becoming more frequent, with longer dry spells in between. Ecosystems are also changing. While day-to-day weather generally remains familiar, it plays out against a backdrop of change, and the mix of weather is slowly evolving as some events become more likely and others less common.
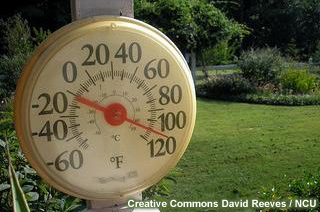
Extreme weather is a bit relative. For example, a hot day in Wyoming would be considered a mild one in Arizona. And we don't generally notice changes in climate because most weather falls within the range of what is expected. It is mainly the extreme events that get our attentionevents that are outside our normal experience and that often inflict human suffering. So how might global warming affect climate extremes and extreme weather? There are several possible ways. Let's look at temperature as one example.
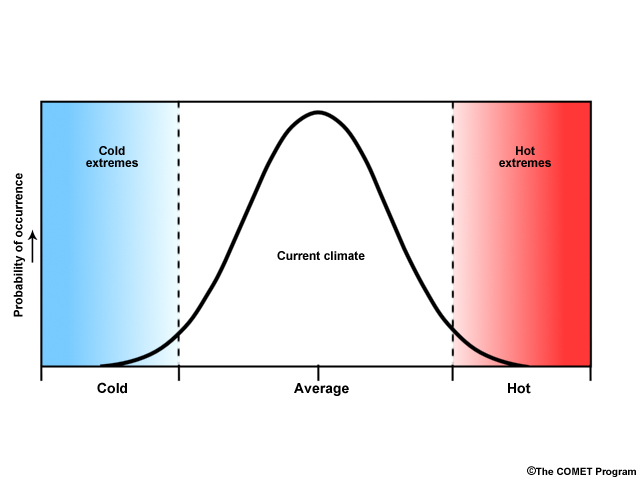
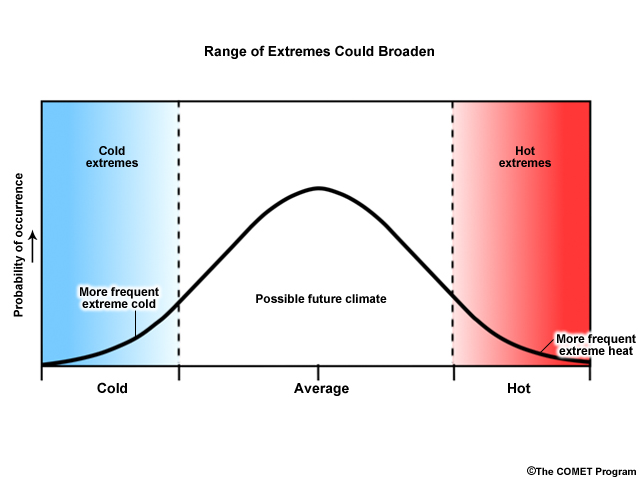
The normal distribution of temperature can be thought of as a bell-shaped curve like this, with the majority of the observations in the middle, but with rare events of extremely cold or extremely warm temperatures at the ends.
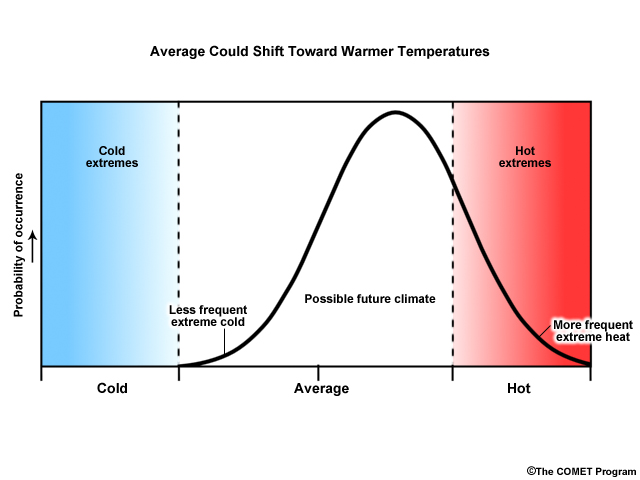
Global warming could shift the distribution to the right—decreasing the frequency of very cold weather events, but greatly increasing the occurrences of hot weather.
Another possibility is that climate change increases the variance in the distribution of temperaturein other words, it increases the range of possibilities at both ends of the distribution.
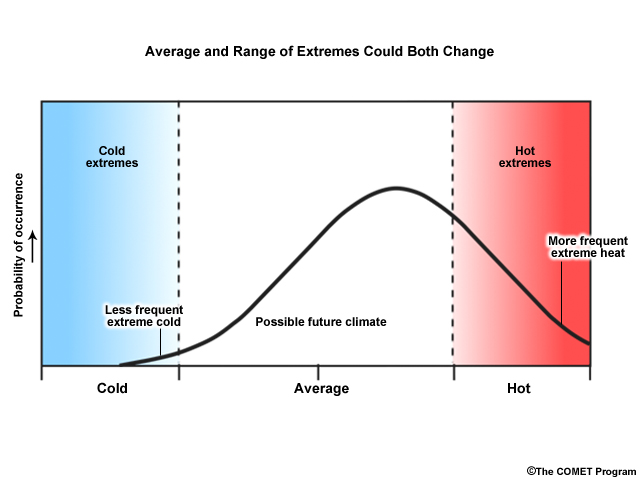
Or climate change could result in a combination of the two types of distributions. We don't know exactly how the distribution of temperature will change, but most climate scientists strongly agree that, on the average, the global climate will continue to warm. However, the effects of this warming in specific locations are less known.
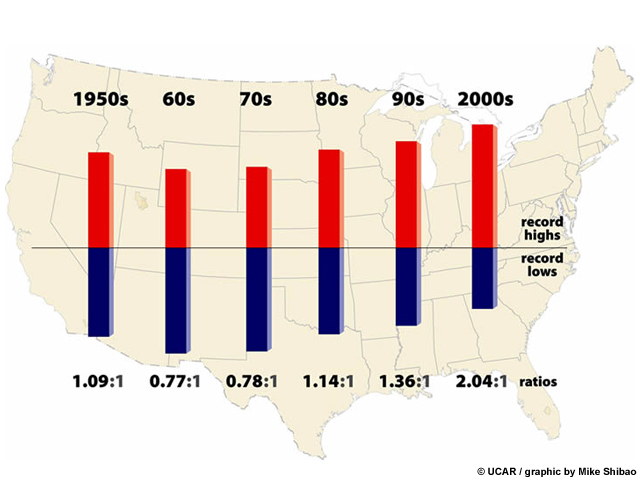
Relative increase of record high maximum temperatures compared to record low minimum temperatures
Nonetheless, we are already seeing the effects of climate change. For example, in the United States, record high temperatures are now occurring more than twice as often as record low temperatures, and similar patterns have been observed across the planet.
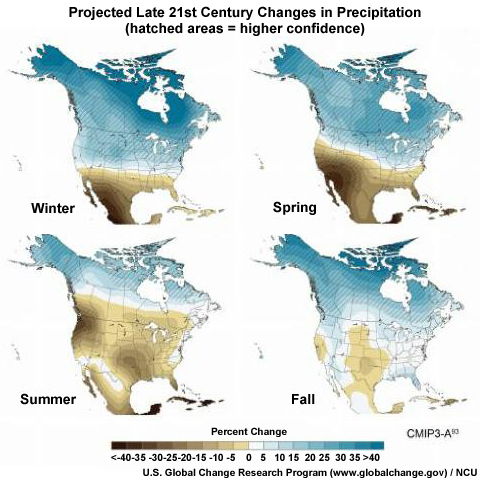
The increase in temperatures leads to other changes throughout the climate system, such as precipitation patterns. For example, warmer air holds more moisture, which leads to changes in both the distribution of precipitation and in precipitation intensity. Since temperature and moisture drive most of the planet's weather, it makes sense that these changes also change the odds of an extreme event turning up.
Natural Variability and Extreme Weather
Extremes in weather are nothing new. Weather varies naturally because of many factors, and those factors can combine to produce an extreme drought or a devastating flood, stronger hurricanes or record snowfalls.
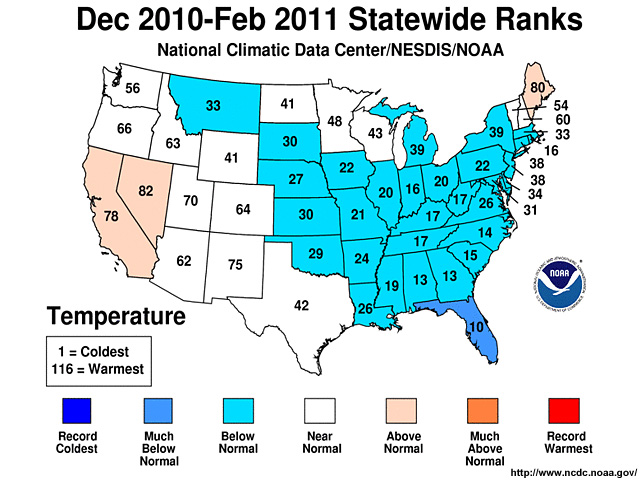
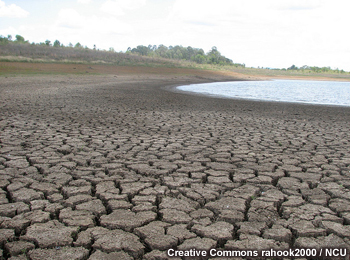
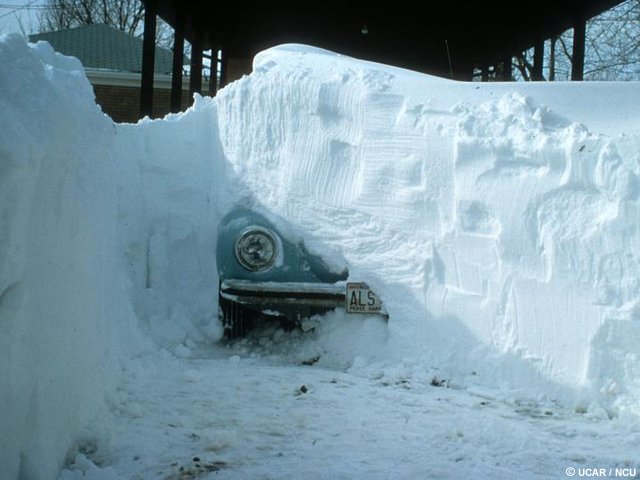
Sometimes, the same general climate pattern can produce drastically different weather conditions in different locations or different years. For example, the unusually cold winter of 2010-2011 in the U.S. was influenced by a La Niña patterna quasi-cyclic cooling of the eastern tropical Pacific ocean.
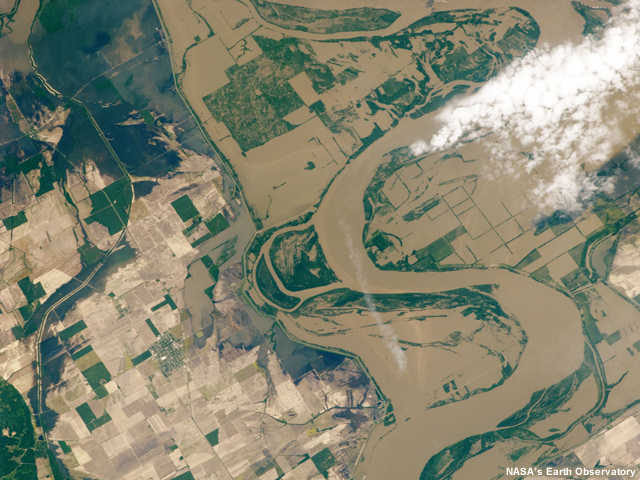
It is very likely that this pattern produced an unusually cold spring with heavy precipitation in the Upper Missouri River Basin. Heavy rains in May fell on deep, late-spring snow pack, which caused flooding that devastated parts of several states.
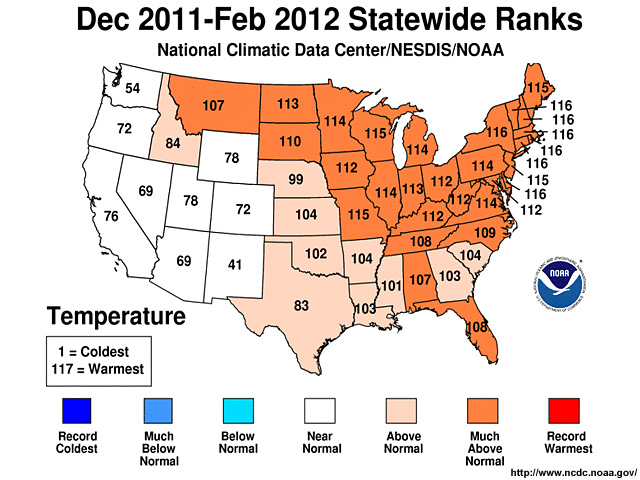
No two El Niño/La Niña-Southern Oscillation events are alike, however. The La Niña pattern persisted through the winter of 2011-2012, although it was somewhat weaker. Surprisingly, that winter was one of the warmest on record in the U.S. A number of factors conspired to produce the two dramatically different results. Part of the difference related to the high latitude pressure patterns (called the Arctic Oscillation) that dominated in the two winters. In the warmer 2011-2012 winter, the pattern tended to trap the cold air near the poles, but why that was the case is still being studied.
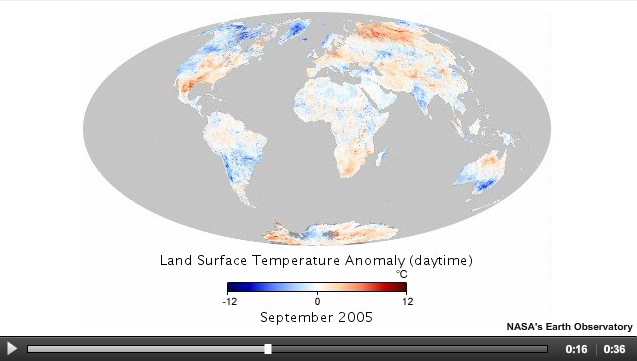
Departures of temperature (anomalies) from average 2000-2008 conditions during the month of March.
We have a good understanding that natural modes of climate variability affect the probability and intensity of weather extremes. So how does global warming come into the mix? In some cases it can mitigate extremes. For example, a record cold winter might be a little less cold than it otherwise would have been. However, climate change could also amplify the effects of a natural cycle, producing more severe extremes. So, for example, a natural pattern that produces warmer-than-normal annual conditions could be enhanced by global warming and result in increased night-time temperatures and more frequent heat waves.
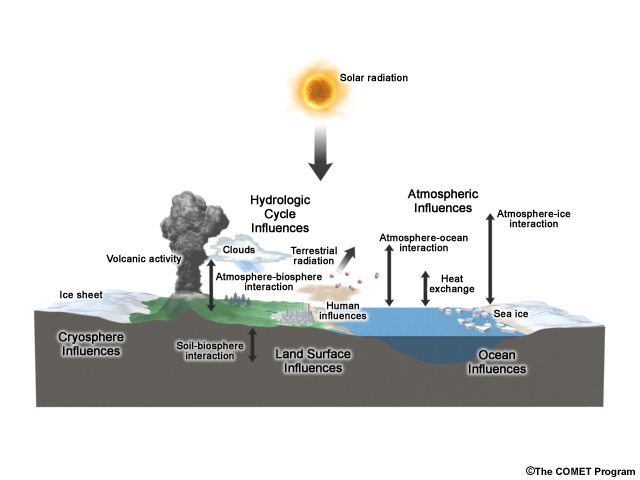
Climate is determined by a complicated interplay of many factors that affect the oceans, land surfaces, and the atmosphere. A change in one of themsuch as increasing atmospheric concentrations of greenhouse gasescan ripple throughout the system.

Of course, extreme weather events can have some positive effects. The warm winter of 2011-2012 in the U.S. resulted in lower heating bills, and many communities also saved by not needing snow removal services.
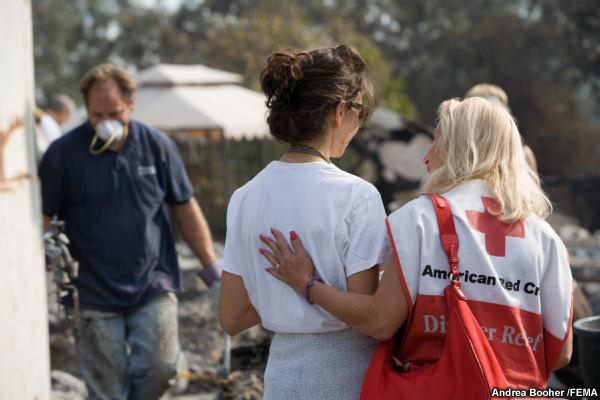
It is an individual's or community's vulnerability to the adverse effects of extremes that largely determines whether a particular event is a disaster or something beneficial.
Role of Climate Change
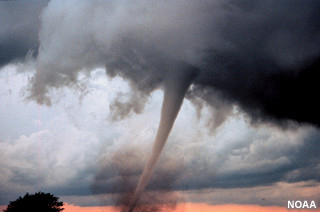
Is a particular weather eventsuch as a tornado outbreak or a record heat wavecaused by natural variability or global warming? There are no definitive answers yet, but scientists are beginning to provide insight into the effect climate change might have on the chances of an extreme event occurring.
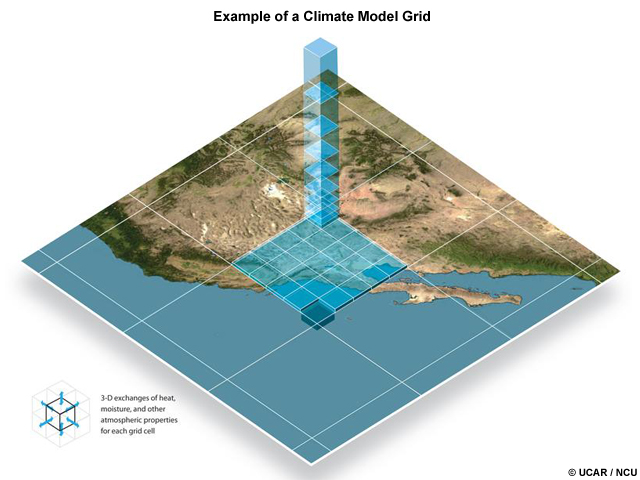
Computer models simulate climate change by dividing the world into 3-dimensional grid boxes, measuring physical processes such as temperature at each grid point.
Using computer models and sophisticated statistical techniques, researchers in the field of attribution science are able to estimate the odds that global warming increased (or decreased) the chances for certain extreme events.
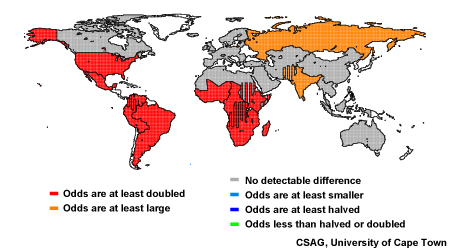
Forecast of the change in the odds of a warmer April (2012) due to greenhouse gas emissions
The science of attributing extreme water and weather events to climate variability and change is relatively new. Several recent case studies have shed light on unusual events such as the 2003 European heat wave and the 2010 Russian heat wave. And, as seen in this image, some scientists are even producing forecasts of the changes in the odds of occurrence for hotter, colder, wetter, and drier events.
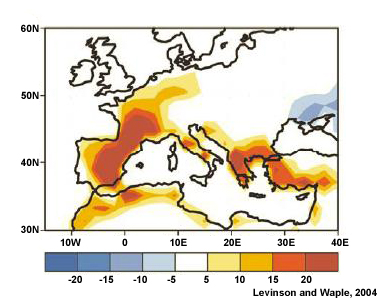
Number of days with temperatures hotter than normal during the 2003 European Heat Wave
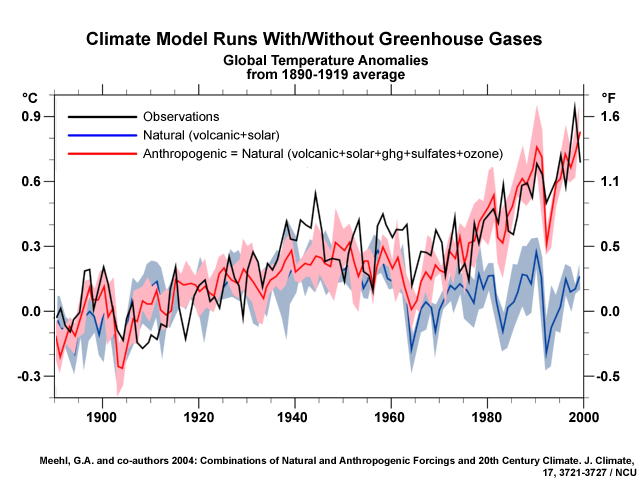
The summer of 2003 was the warmest in at least the past 500 years in Europe. European Community scientists correlate the 2003 summer European heat wave with 70,000 deaths above what would normally be expected. Researchers wanted to know if this heat wave was simply an extremely unusual natural event or whether climate change created an environment that altered the pattern of natural variability. Using a climate model, they analyzed the probabilities of exceeding the 2003 seasonal mean temperature under 2003 conditions, including the build-up of greenhouse gases from human activities. They then ran the model again without those greenhouse gases. Their conclusion is that global warming probably at least doubled the chances of the heat wave.
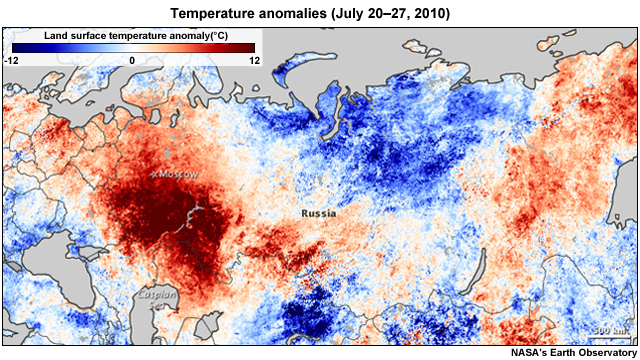
In the case of the 2010 Russian heat wave, researchers found the magnitude of that event was primarily caused by natural factors. Other scientists, who used a different approach, found that the risk of these types of events in western Russia has increased greatly due to global warming. It appears that, even if natural factors were the main cause of this particular weather extreme, the added strength produced by climate change pushed it to a new and dangerous level.
These early studies show promise, but much more work needs to be done to expand the regional areas and the types of weather events for which these studies are conducted. Researchers hope that improvements in attribution techniques will eventually lead to developing improved early warning capabilities.
Changes in Extreme Events
We know that all weather results from a combination of interdependent factors, one of which is the warmer temperatures observed in the last 50 years. And computer models show that human emissions of greenhouse gases do account for much of that warming. So what does this mean for extremes in the US? Based on observations, model projections, and expert judgments, we can be confident of the following:
Cold Weather: Warmer and fewer cold days and nights
Observations indicate that cold extremes are less frequent and milder. Climate models predict that trend is very likely to continue throughout this century.
Hotter and more frequent hot days and nights and heat waves
Most of North America has experienced more frequent and intense heat extremes, which are also very likely to continue through the 21st century.
More frequent and intense heavy rainfall
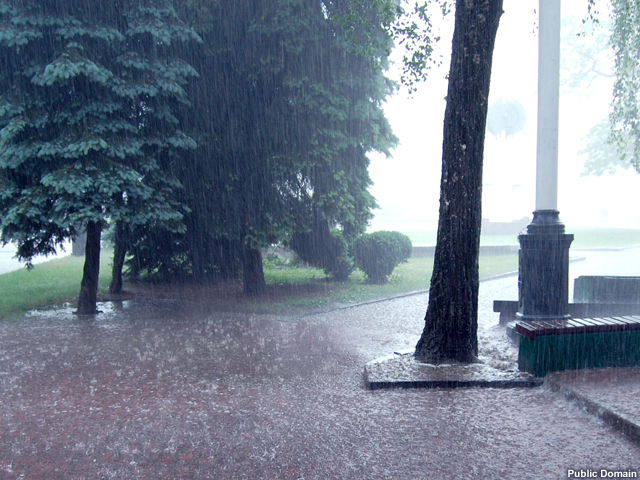
Many areas in the U.S. have seen an increase in the heaviest downpours, and that pattern is very likely to continue in the future.
Increases in areas affected by drought
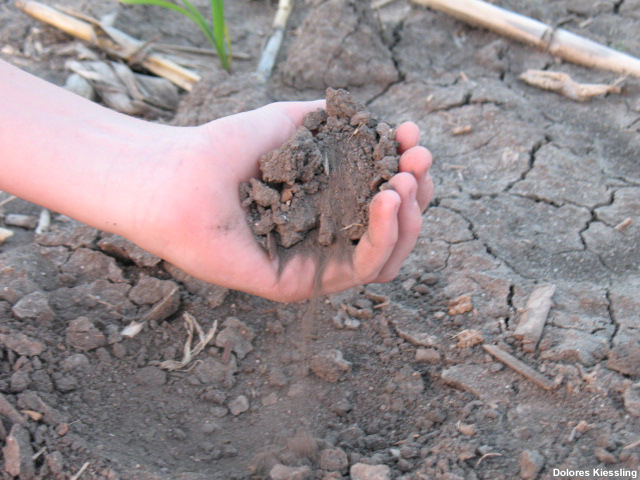
Regions that already experience long-duration droughts, such as the Southwestern U.S. and parts of Mexico and the Caribbean, will likely see the area affected increase.
More intense hurricanes
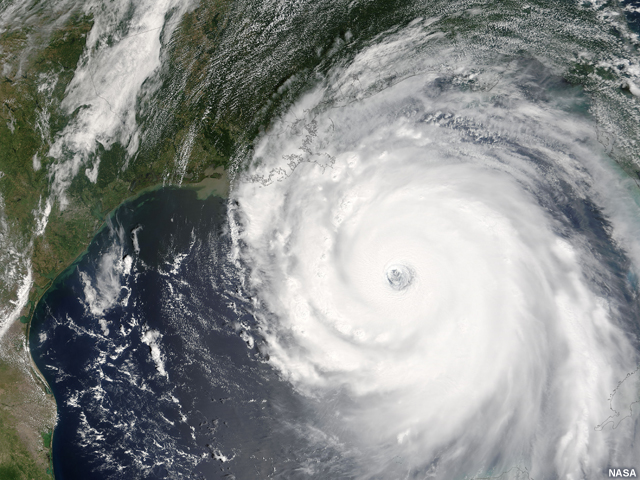
Observations indicate an increase in hurricane intensity in the Atlantic and West Pacific (but a decrease in the eastern Pacific). Experts and models project those tendencies are likely to continue in the future.
Scientists are working to clarify what these changes might mean regionally or locally. For more information, see the modules, "Climate Change and Regional Impacts" and "Climate Change and Sea Level Rise."
This concludes the module. Please consider taking the quiz or sending a survey (use links on the sidebar).