Weather Shifts
Climate and weather events now take place in a world that is different from the one our grandparents knew. The average temperature of the atmosphere is warmer. Oceans are also heating up, and polar ice is melting, as are many glaciers. Heavy bouts of rain and snow are becoming more frequent, with longer dry spells in between. Ecosystems are also changing. While day-to-day weather generally remains familiar, it plays out against a backdrop of change, and the mix of weather is slowly evolving as some events become more likely and others less common.
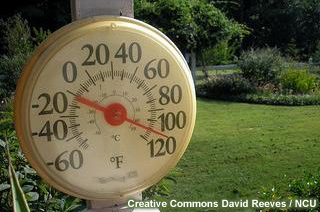
Extreme weather is a bit relative. For example, a hot day in Wyoming would be considered a mild one in Arizona. And we don't generally notice changes in climate because most weather falls within the range of what is expected. It is mainly the extreme events that get our attentionevents that are outside our normal experience and that often inflict human suffering. So how might global warming affect climate extremes and extreme weather? There are several possible ways. Let's look at temperature as one example.
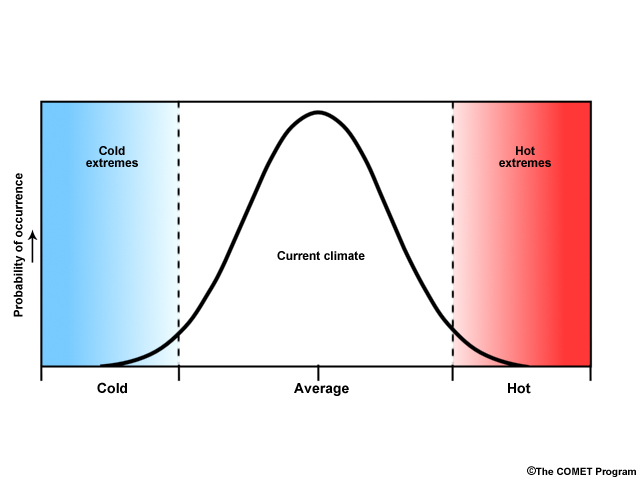
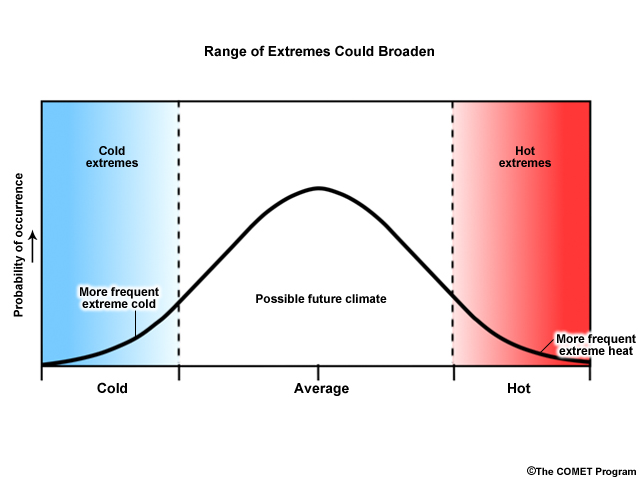
The normal distribution of temperature can be thought of as a bell-shaped curve like this, with the majority of the observations in the middle, but with rare events of extremely cold or extremely warm temperatures at the ends.
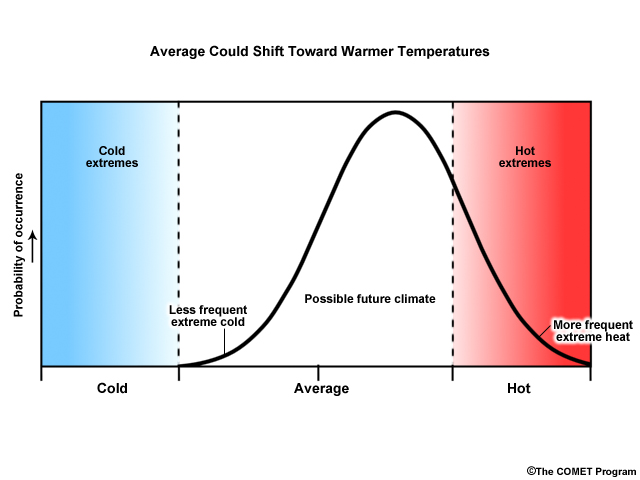
Global warming could shift the distribution to the right—decreasing the frequency of very cold weather events, but greatly increasing the occurrences of hot weather.
Another possibility is that climate change increases the variance in the distribution of temperaturein other words, it increases the range of possibilities at both ends of the distribution.
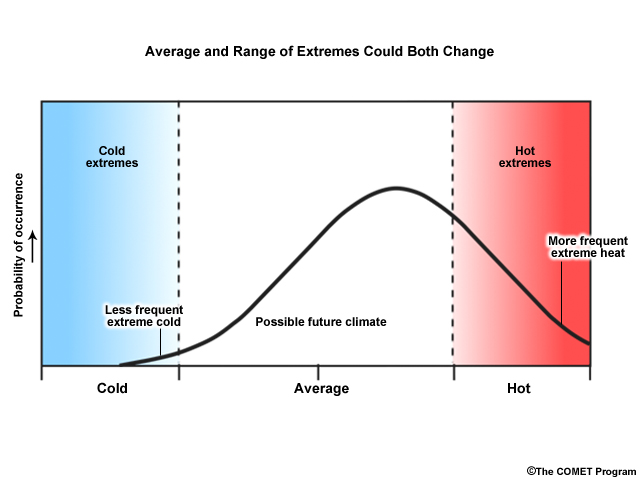
Or climate change could result in a combination of the two types of distributions. We don't know exactly how the distribution of temperature will change, but most climate scientists strongly agree that, on the average, the global climate will continue to warm. However, the effects of this warming in specific locations are less known.
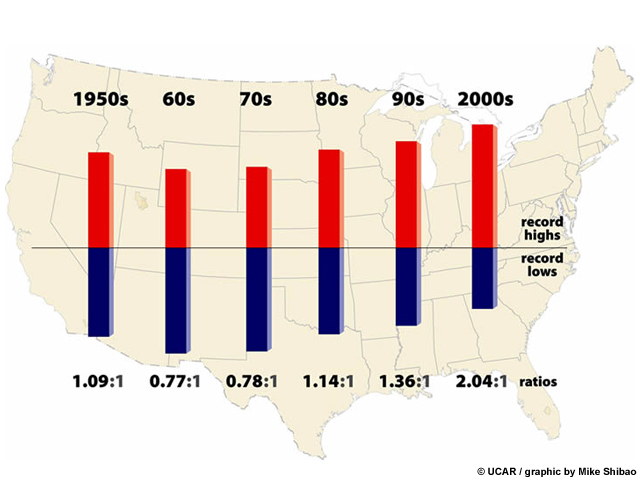
Relative increase of record high maximum temperatures compared to record low minimum temperatures
Nonetheless, we are already seeing the effects of climate change. For example, in the United States, record high temperatures are now occurring more than twice as often as record low temperatures, and similar patterns have been observed across the planet.
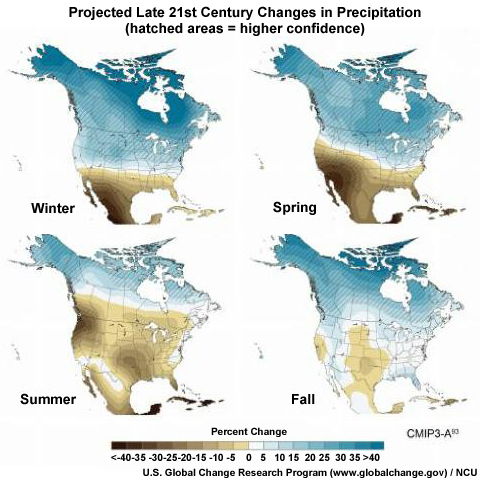
The increase in temperatures leads to other changes throughout the climate system, such as precipitation patterns. For example, warmer air holds more moisture, which leads to changes in both the distribution of precipitation and in precipitation intensity. Since temperature and moisture drive most of the planet's weather, it makes sense that these changes also change the odds of an extreme event turning up.